Today’s Managing Health Care Costs Indicator is 10%
Martha Coakley, the Massachusetts Attorney General, just released her 2011 report on health care in the Commonwealth.
The AG’s office delivered civil investigative demands, the equivalent of a subpoena, to three major health plans and 16 different provider organizations. They then reviewed payment rates among the plans and providers, and incorporated health plan risk adjustment in their analyses. They also reviewed available quality data – which showed little correlation with cost.
There are 55 pages of gems here – and I’ll talk about the relation of wealth and health care costs in a future post.
The news reports I’ve heard so far have concentrated on disparities of provider payments – with some providers getting payments as much as twice as high as others. The AG’s office concludes that addressing price inequities was a prerequisite to lowering the cost of health care, and that moving to global or bundled payments alone will not solve our health care cost crisis.
I’m still digesting this document. Here’s a link to the Boston Globe report in today’s paper.
I’d like to highlight a few of the report’s conclusions today.
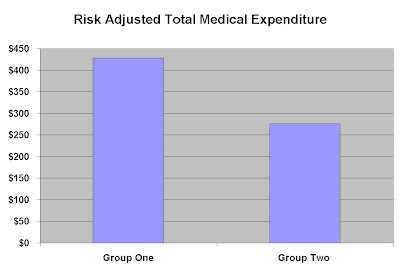
1. There is substantial disparity in total medical expenditure, risk adjusted, from provider group to provider group. Here's an example from the AG report:
2. The Children's Hospital provider organization is high cost in all three health plans, and there are a few other providers which appear in the top five most expensive in all three health plans. However, there is a huge amount of scatter in which groups get paid more and which get paid less. Market clout is similar for provider groups with each payer – so it’s surprising to see such widespread differences. Here are the three relevant graphs - double click on each one to enlarge.
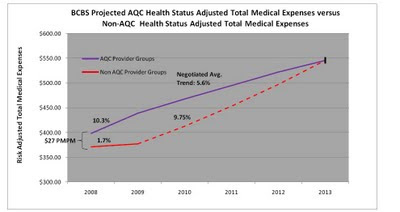
3. The BCBSMA Alternative Quality Contract, which includes a global budget, appears to increase the short-term total medical expenditure. The non-AQC groups, which include Partners HealthCare, have lower costs in the first place and a lower trend rate than the AQC groups. The annual trend during 2009, the first year of the AQC, the trend for the nonAQC groups was 1.7%, while the trend for the AQC groups was 10%. It’s striking that BCBSMA projects that the costs per member per month for the AQC groups will converge with the nonAQC groups in 2013 – and that costs which are now ~$375- $400 pmpm will be just under $550 pmpm
I’ll have more thoughts on this report in the coming days.
 6:18 AM
 indigo


